Danza de las estaciones
Spain's seasonal searches · April 2012
The original explanation groups periodic searches from Spain by similarity in their normalised time series, using Pearson correlation and Google Correlate. This final version focuses on patterns spanning at least two or three months. The original text notes that shorter windows bring local festivals and calendar holidays to the foreground. This is a historical map, not current search data.
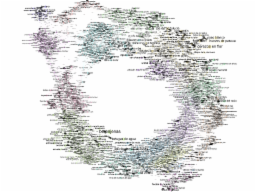
Reading the map: open the full-size view, then scroll horizontally and vertically inside its frame. Keyboard users can focus the frame and use arrow keys. The map is 8192 × 6144 pixels; its original 768 high-resolution tiles load as needed by browsers that support lazy loading. Opening and exploring the full image can transfer about 28 MB. No JavaScript, external viewer or analytics is used.
Open the full-resolution historical map
The outer margins and centre contain substantial blank space. Jump to a labelled cluster to start exploring.









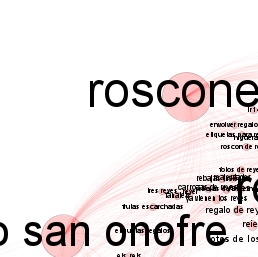
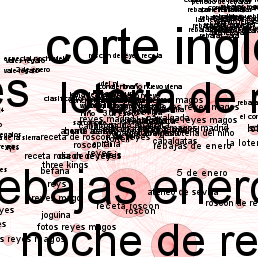
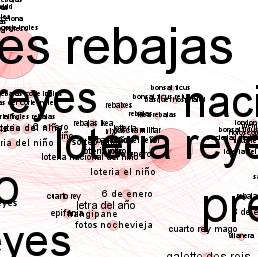
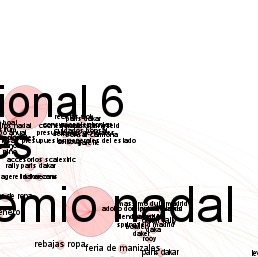





















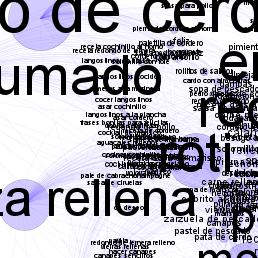
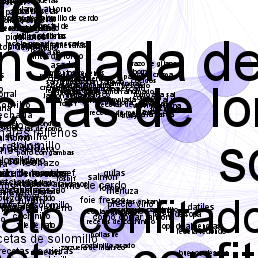

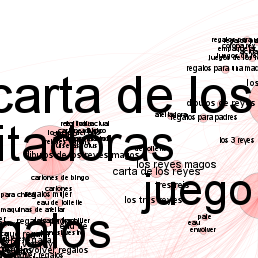
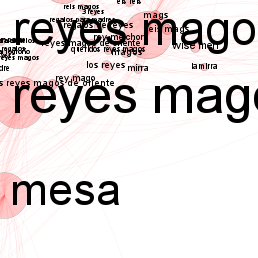
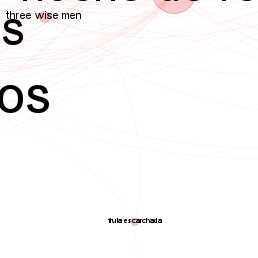
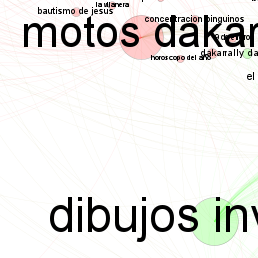
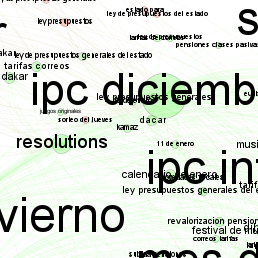
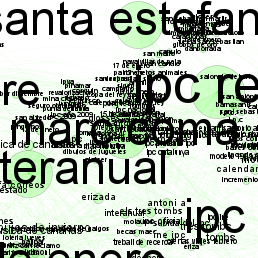
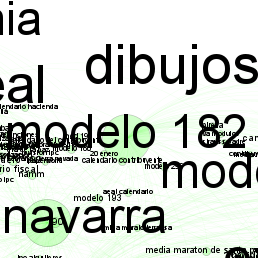
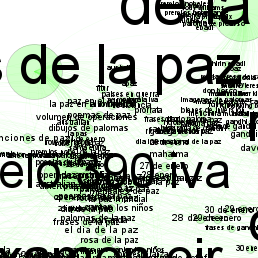

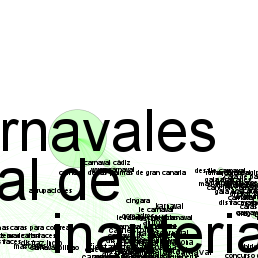
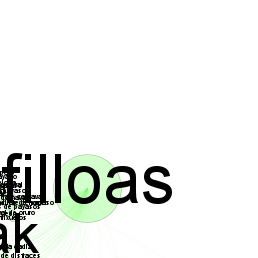















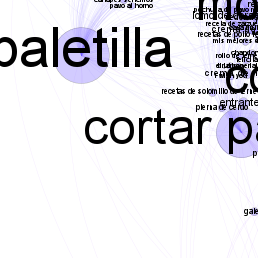
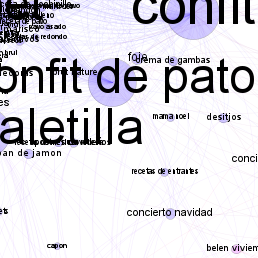
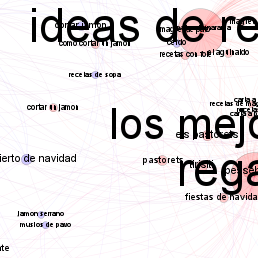
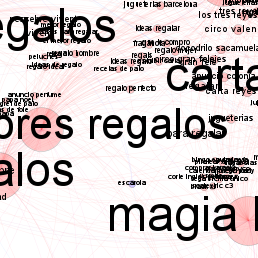
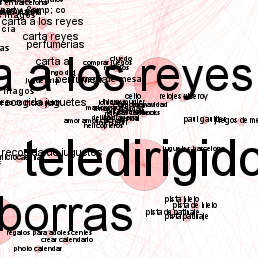

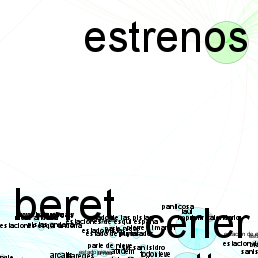
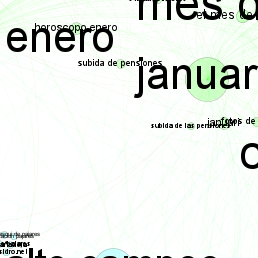
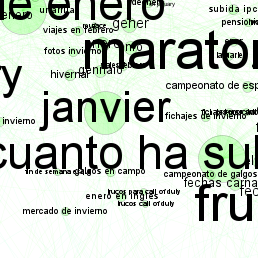
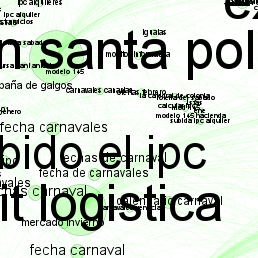
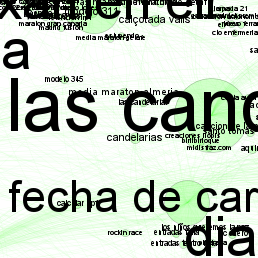
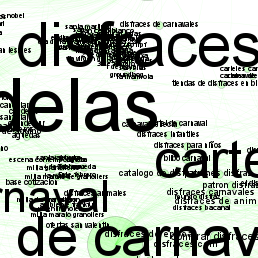
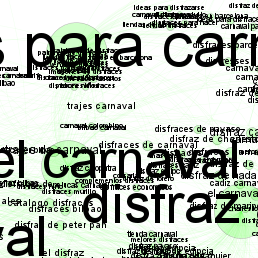
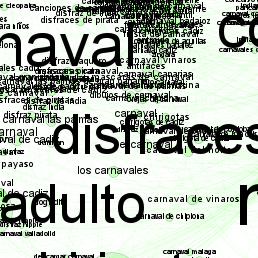
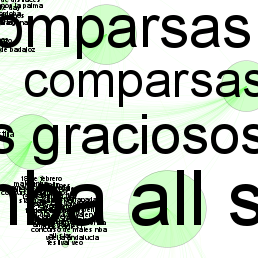














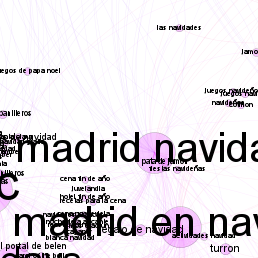
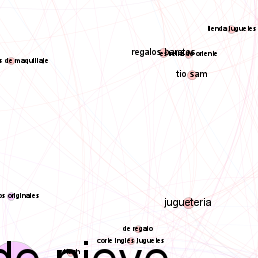
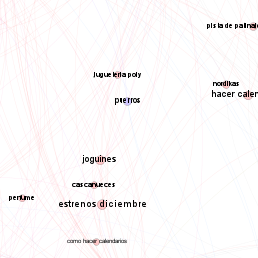
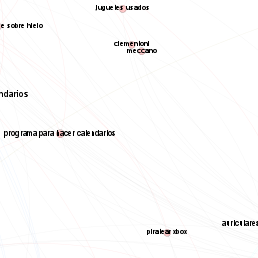
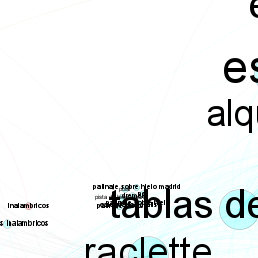
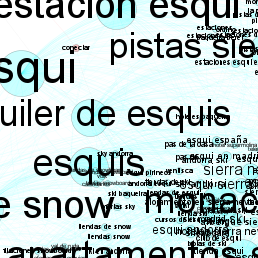
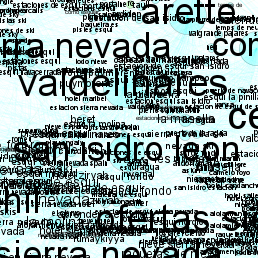
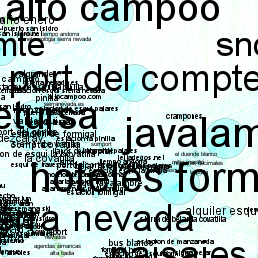
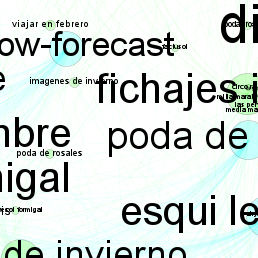
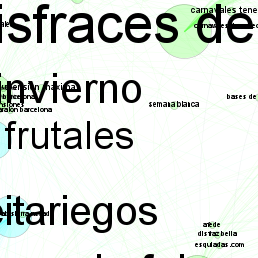
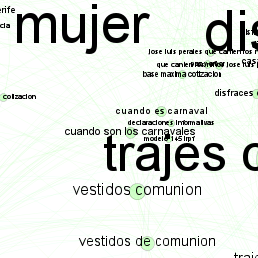
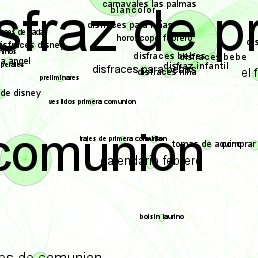
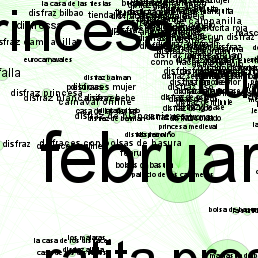
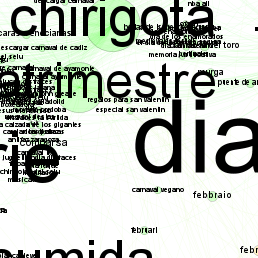
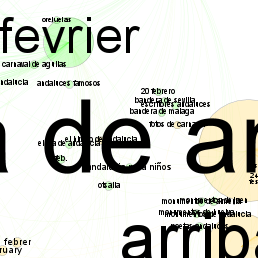
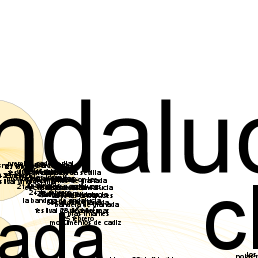
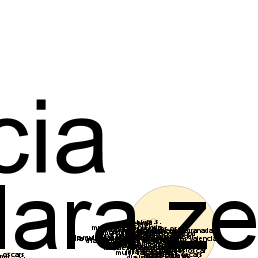












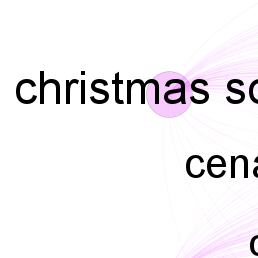
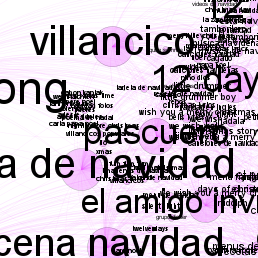
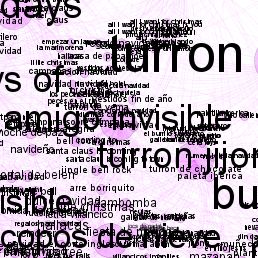
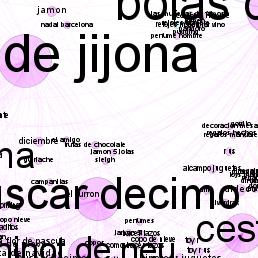
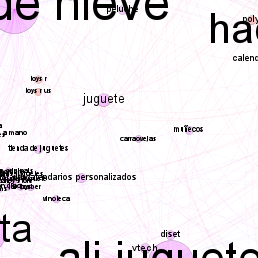
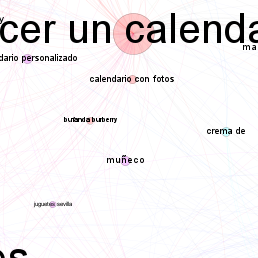
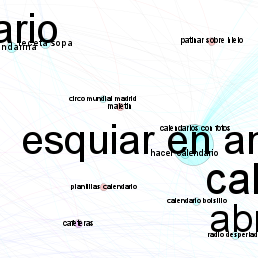
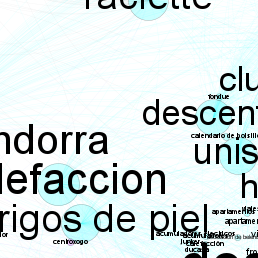
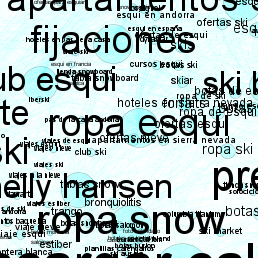
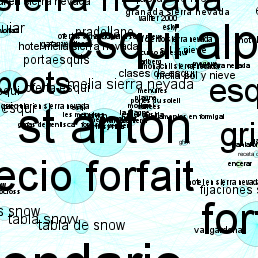
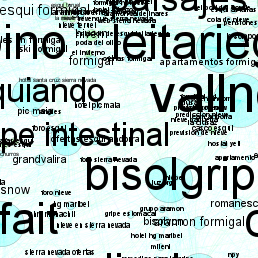
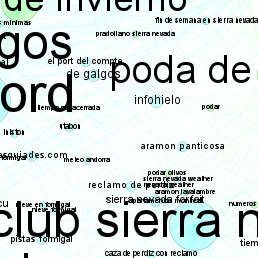
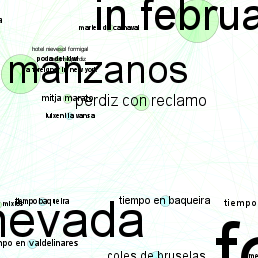
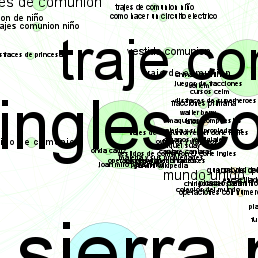
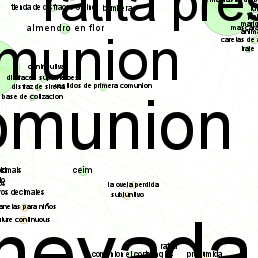
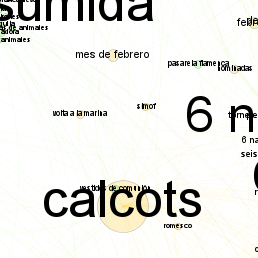
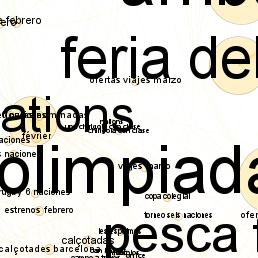
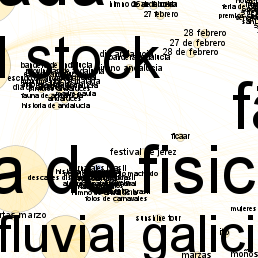
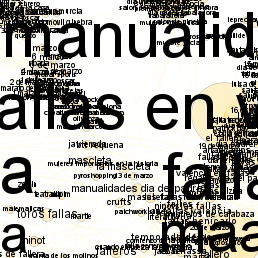
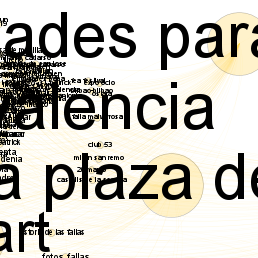

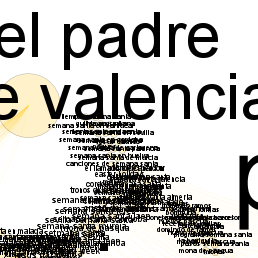







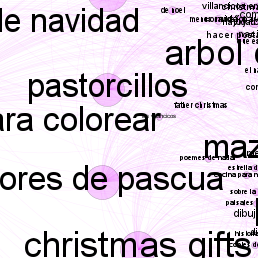
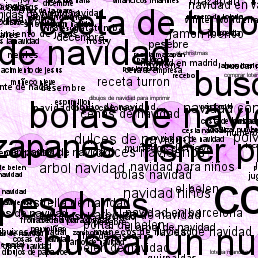
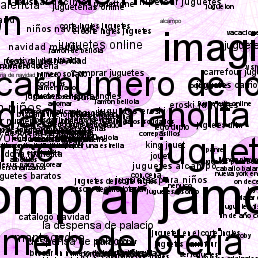
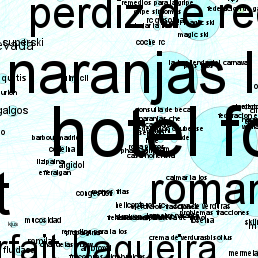
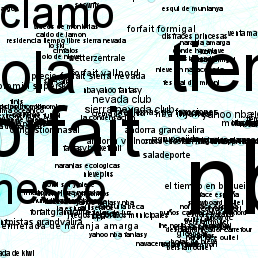
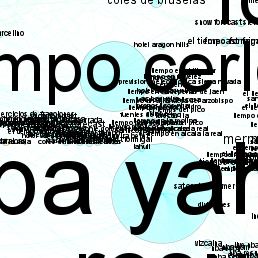
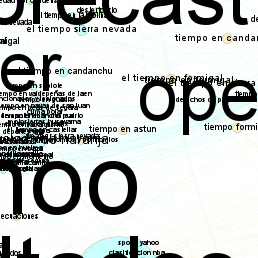
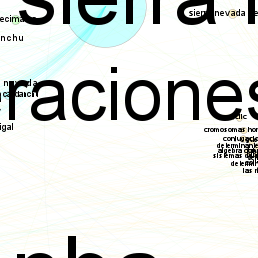
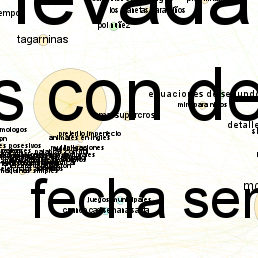
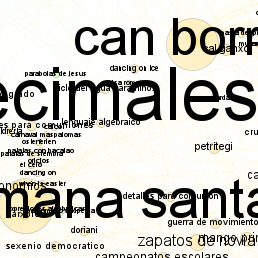
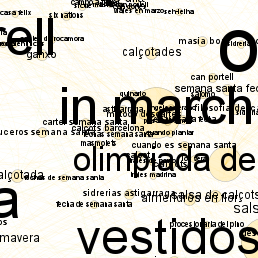
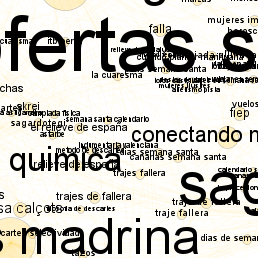
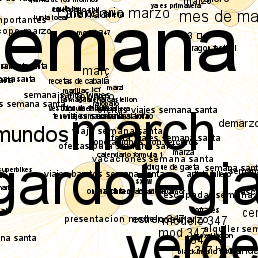
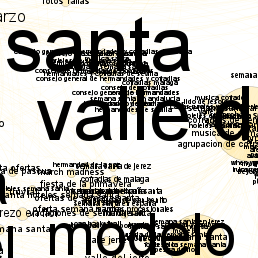
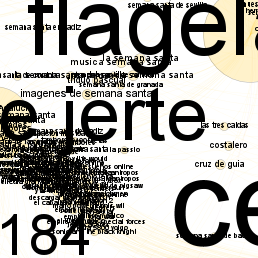
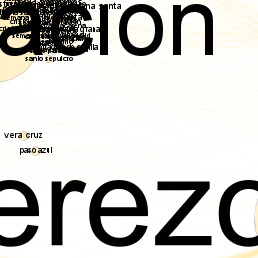









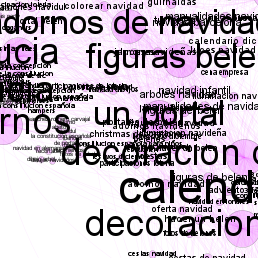
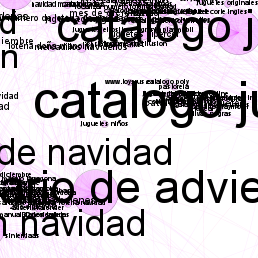


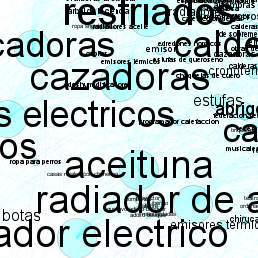
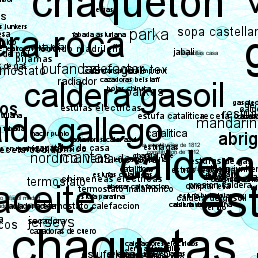
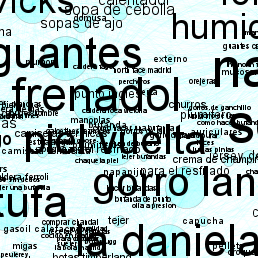
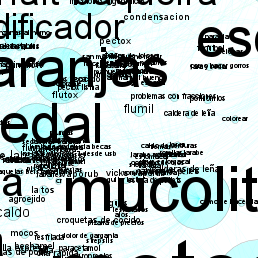

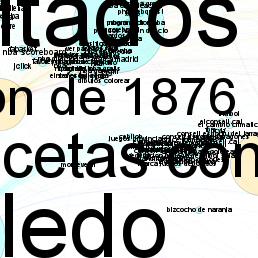
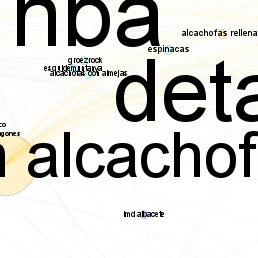
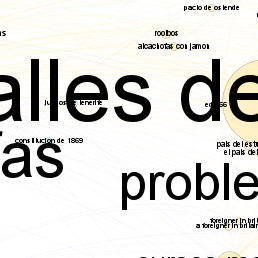
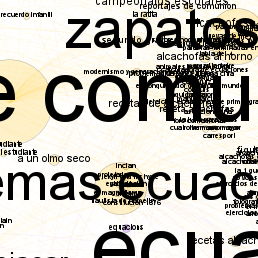
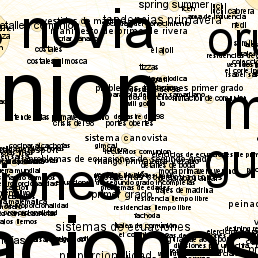
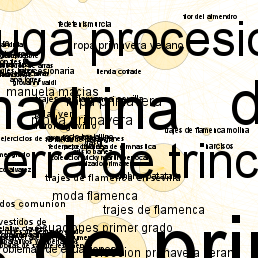
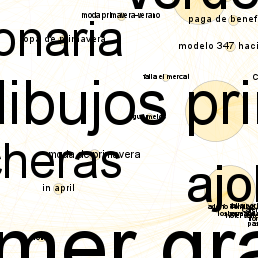
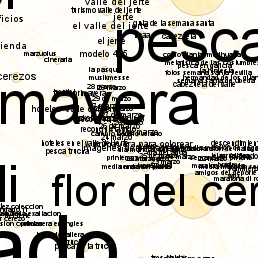
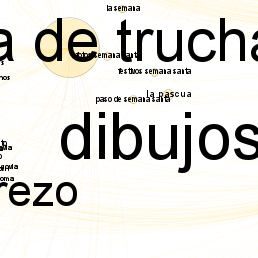










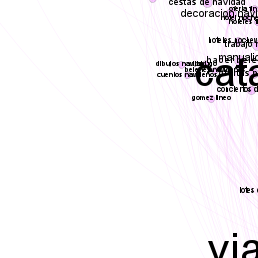
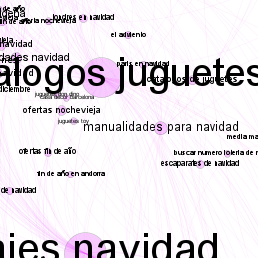
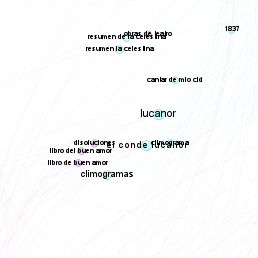
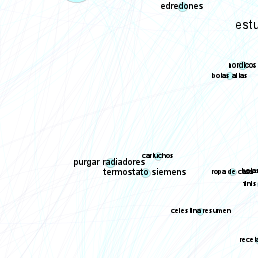
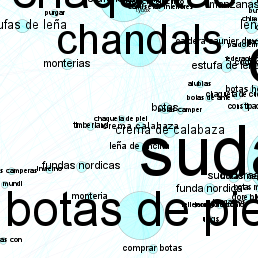
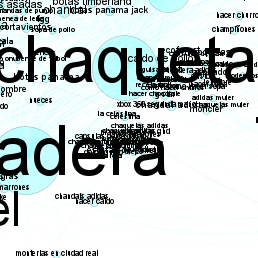
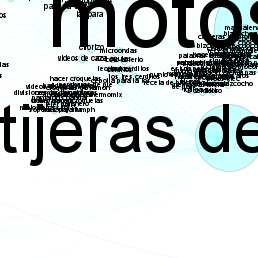


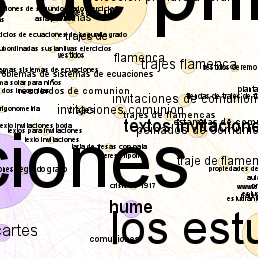
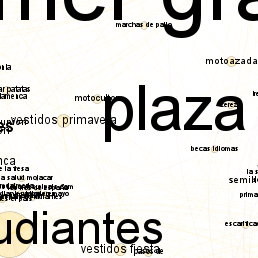
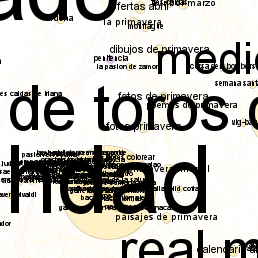
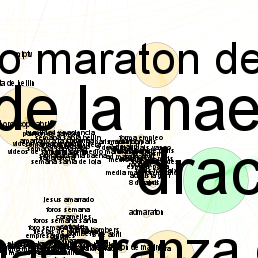
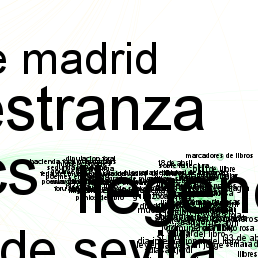
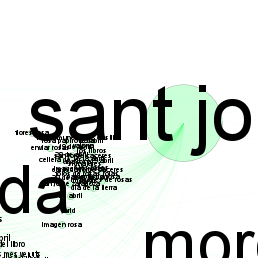











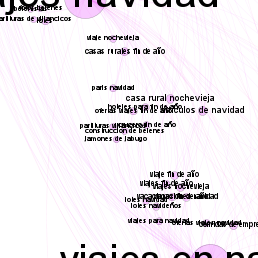
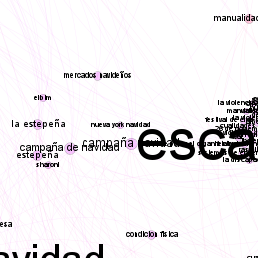
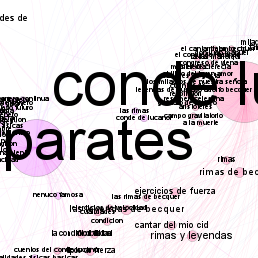
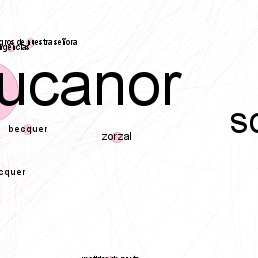
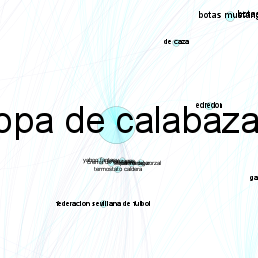
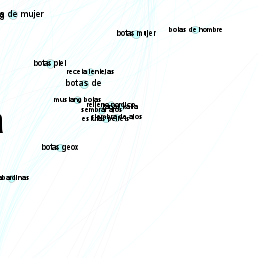





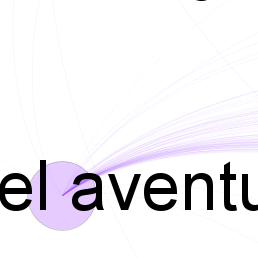
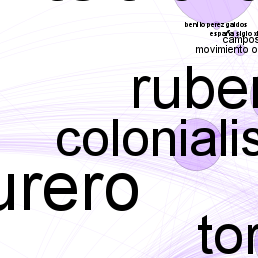
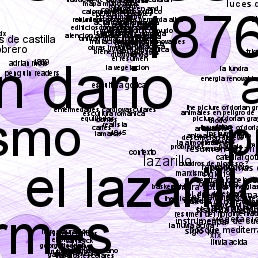
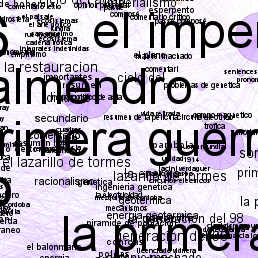
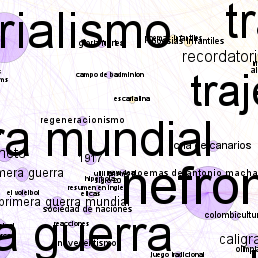
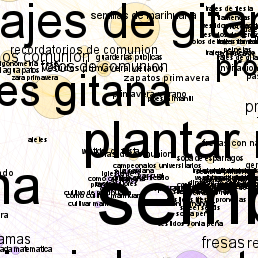
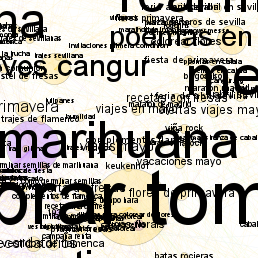
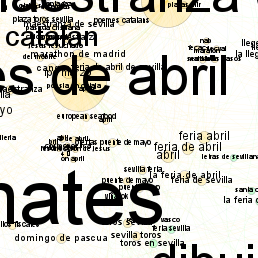
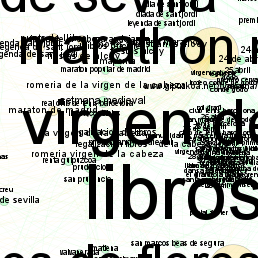
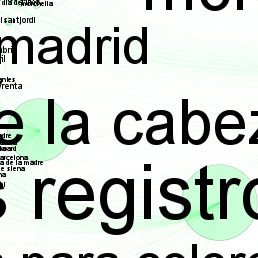









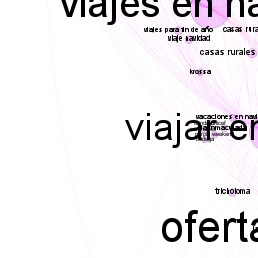
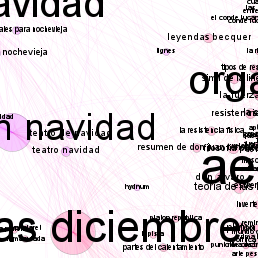
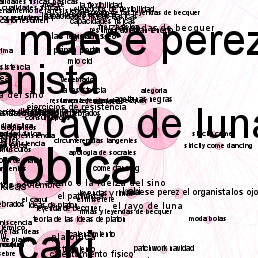
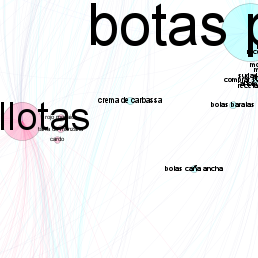
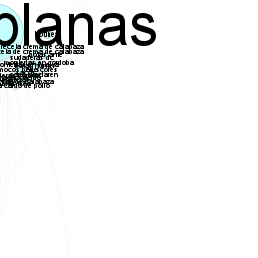






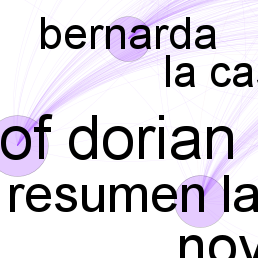
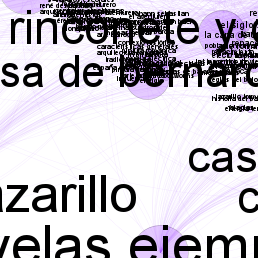
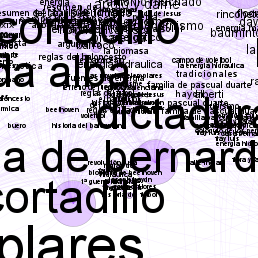
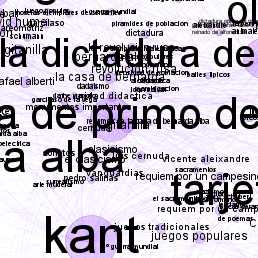
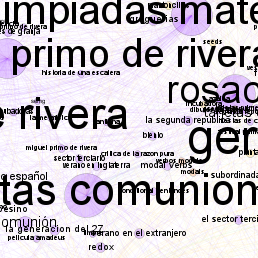
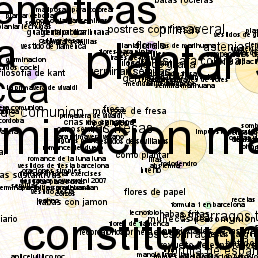
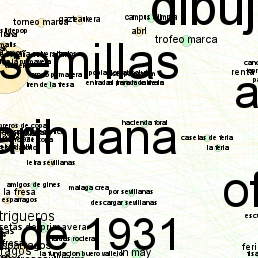
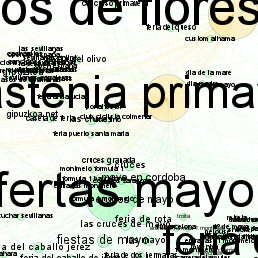











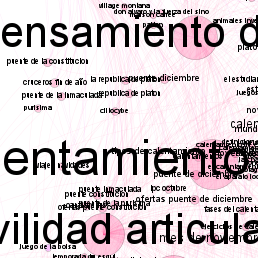
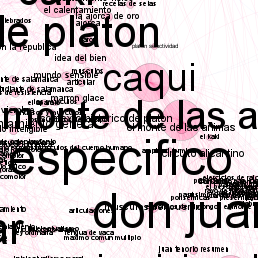
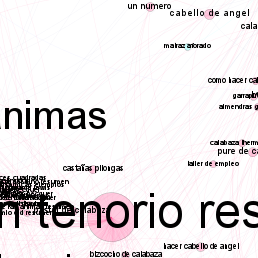
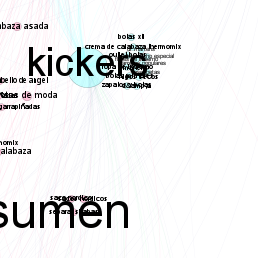








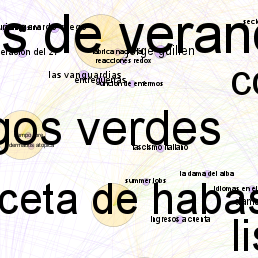
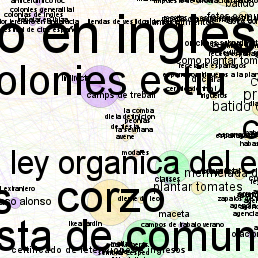
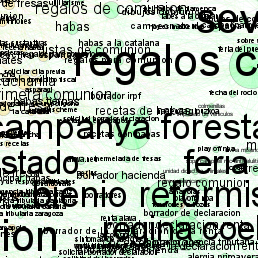
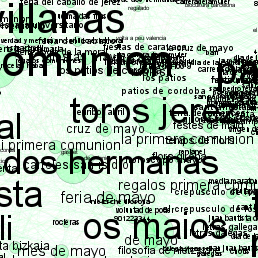
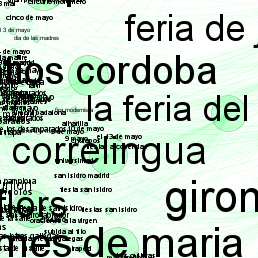
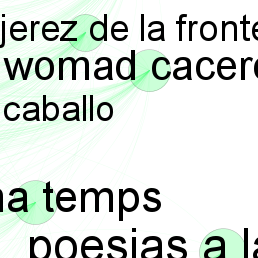









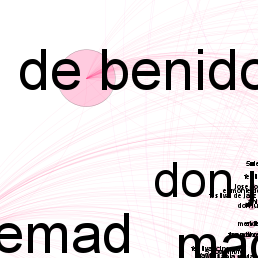
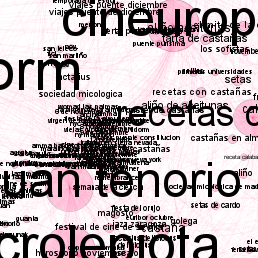
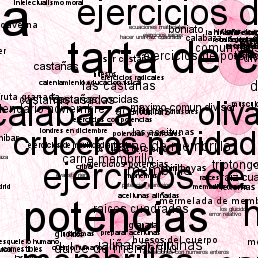
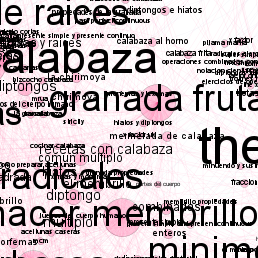











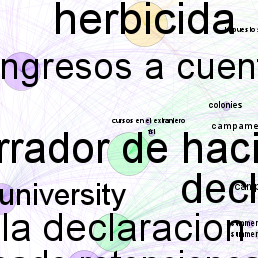
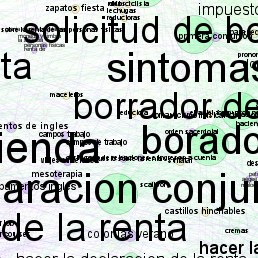
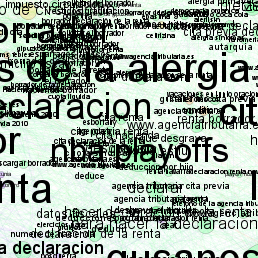
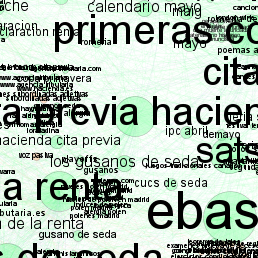
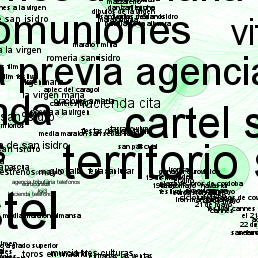
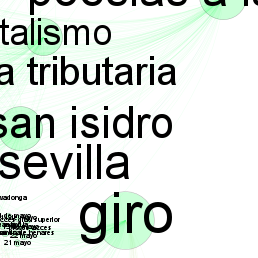










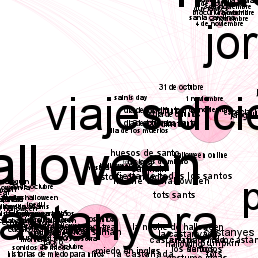
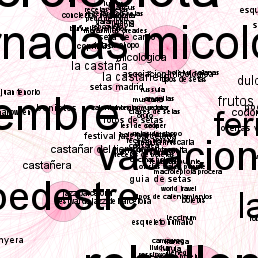
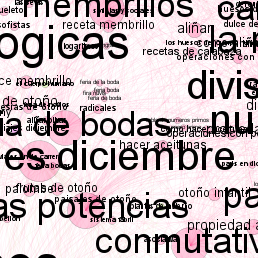
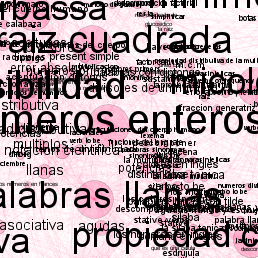
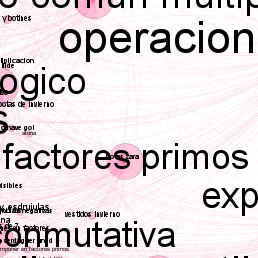









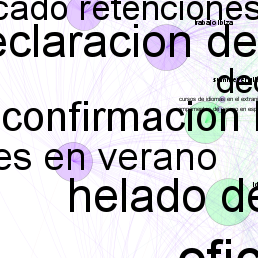
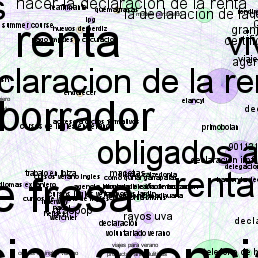

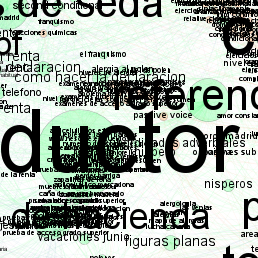
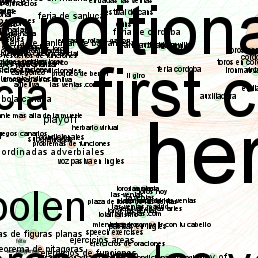
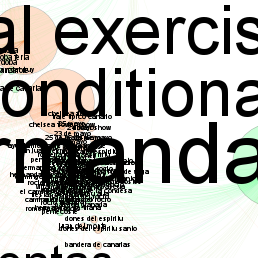








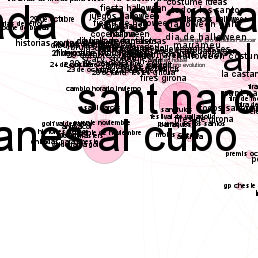
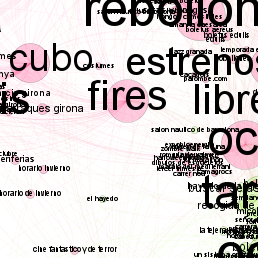
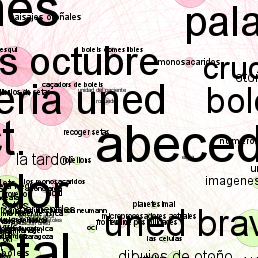
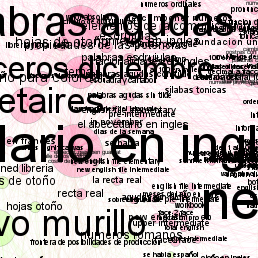
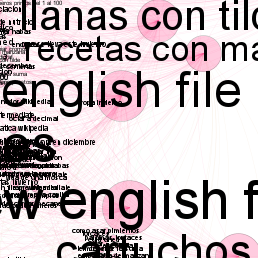










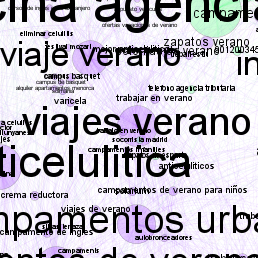
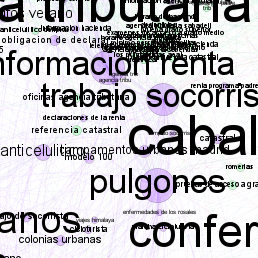
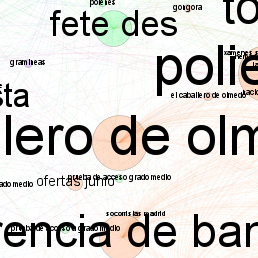
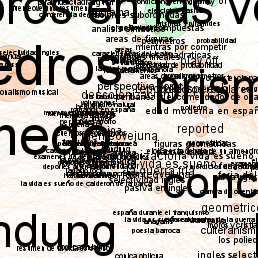
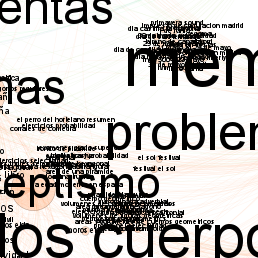









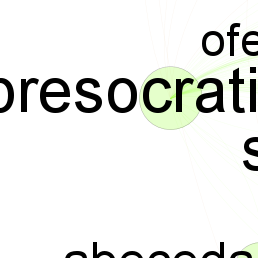
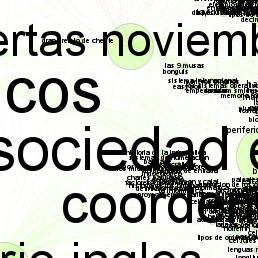
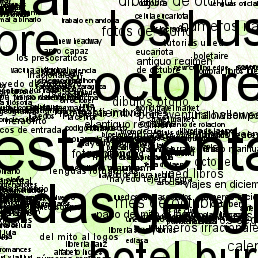
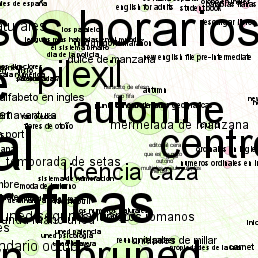
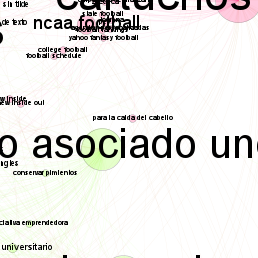










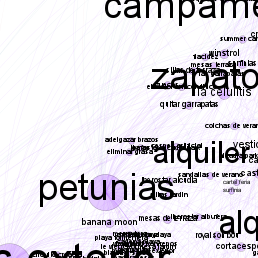
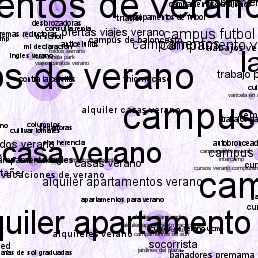
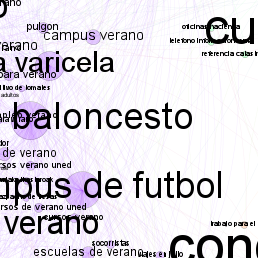
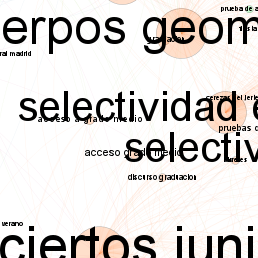
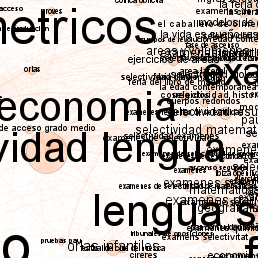
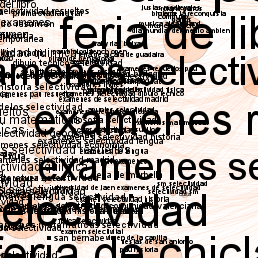
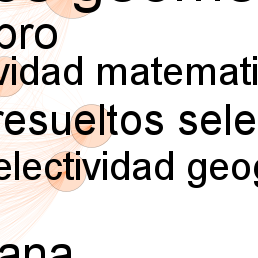








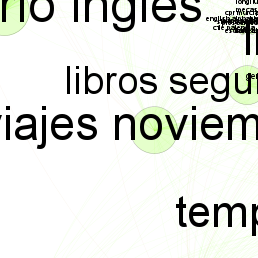
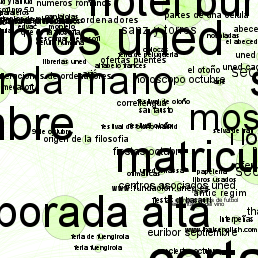
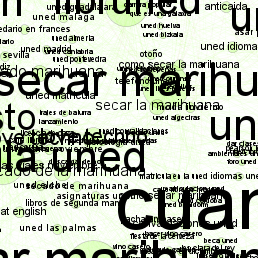
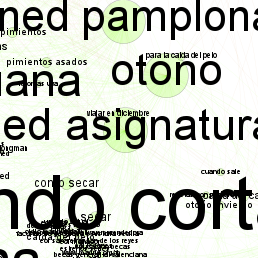









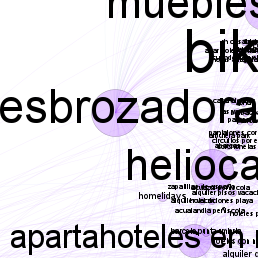
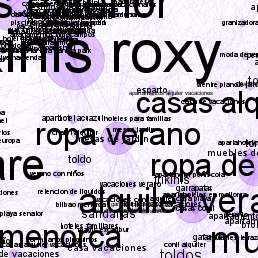
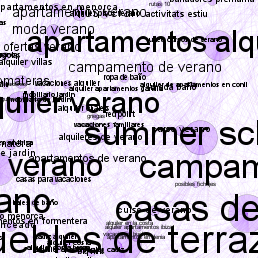
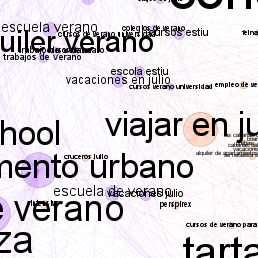
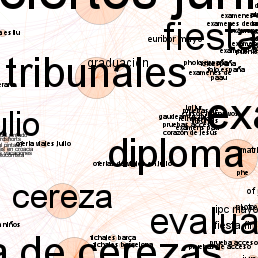
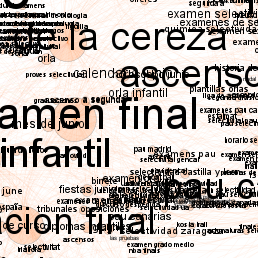
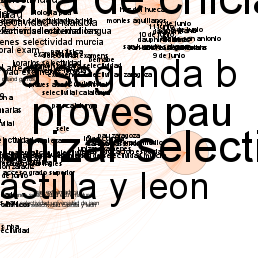










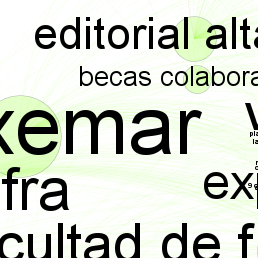
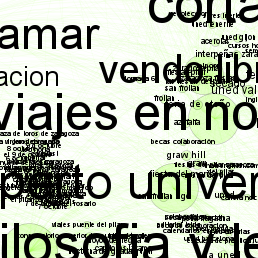
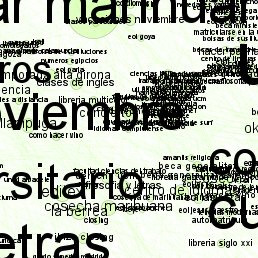
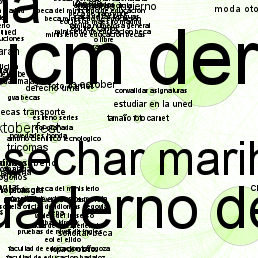
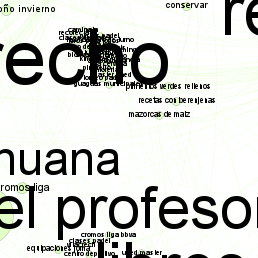
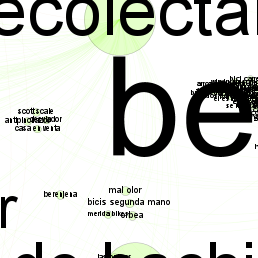
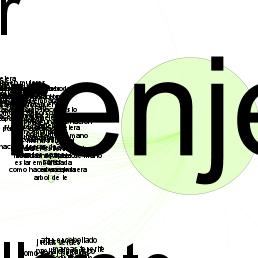





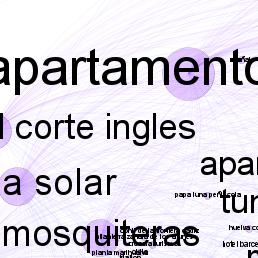
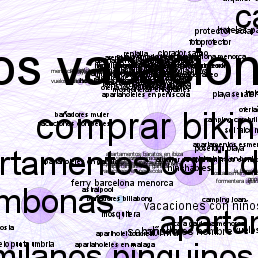
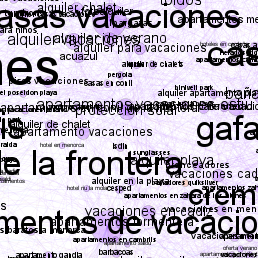
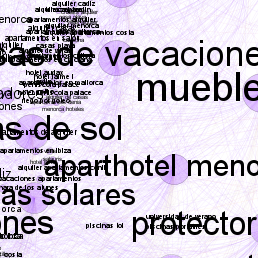
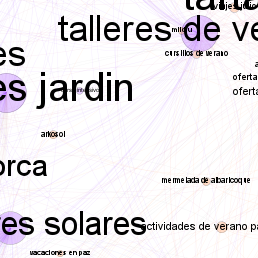
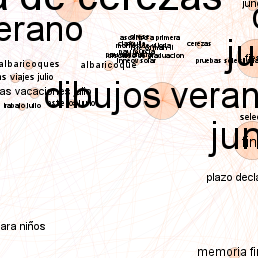
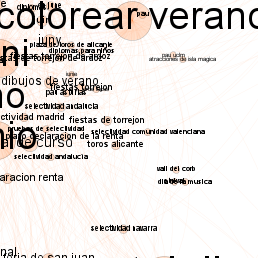










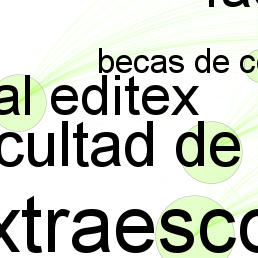
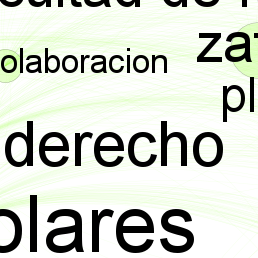
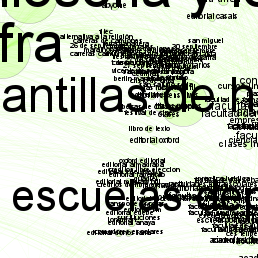
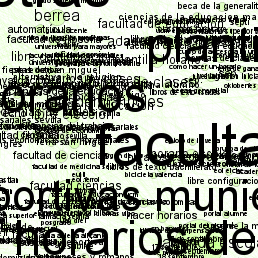
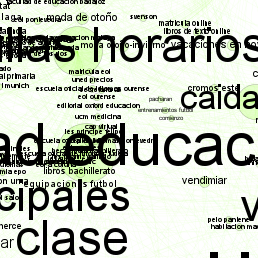
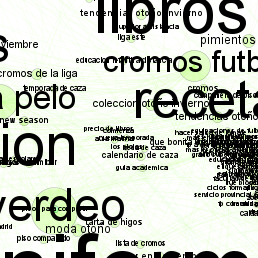
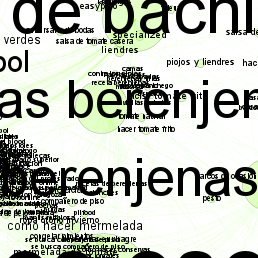
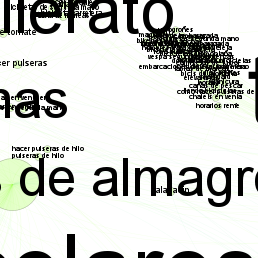



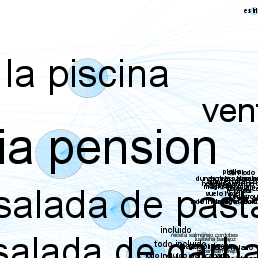
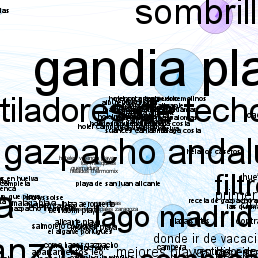
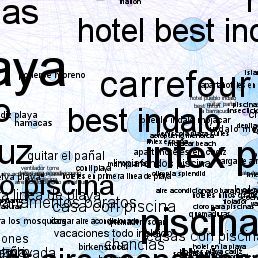
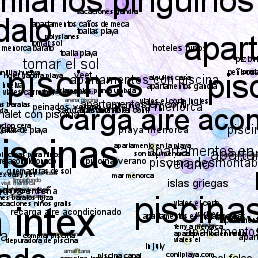
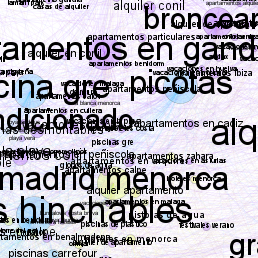
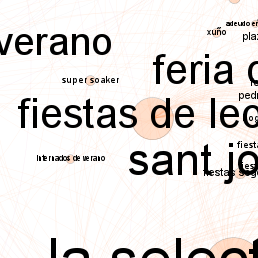
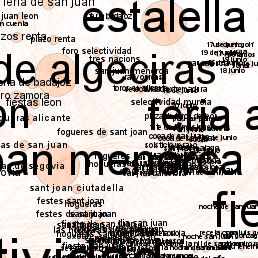











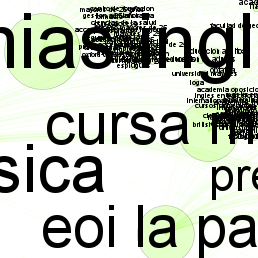
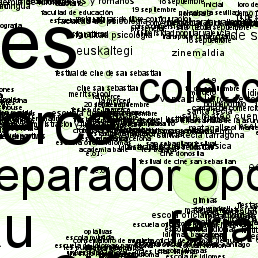
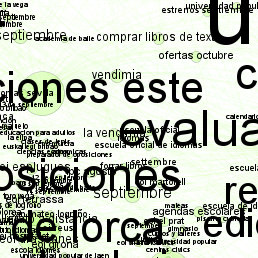
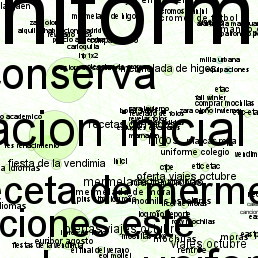
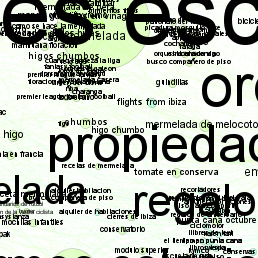
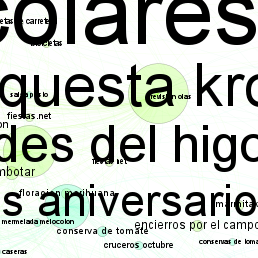
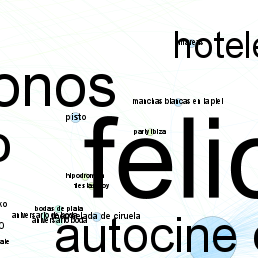
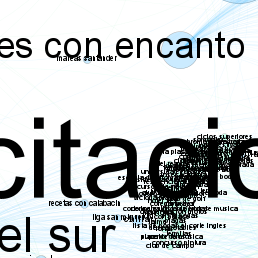
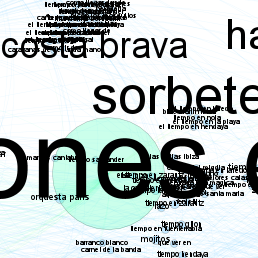
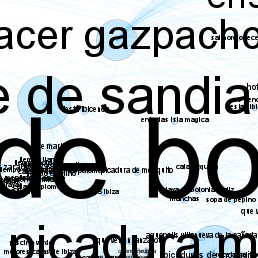
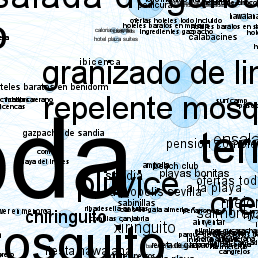
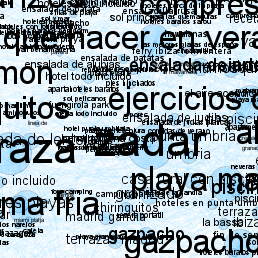
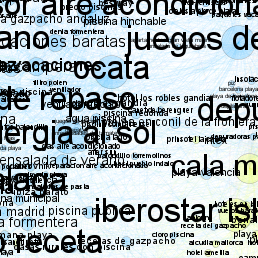
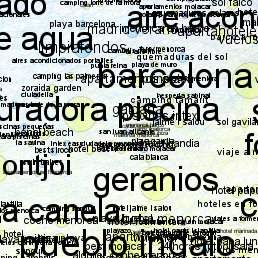
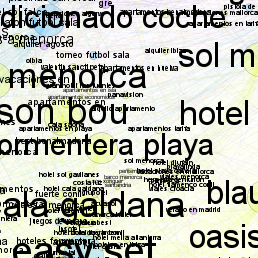
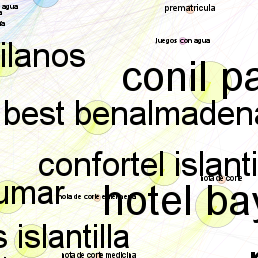
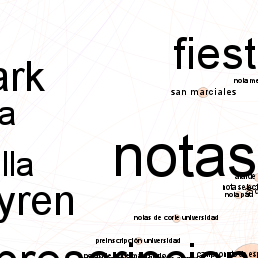
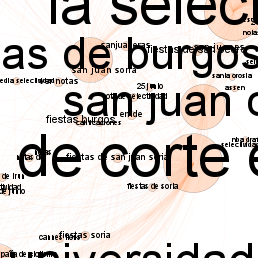














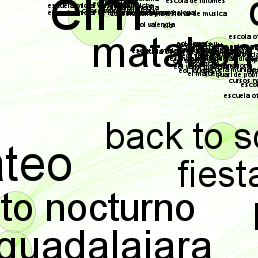
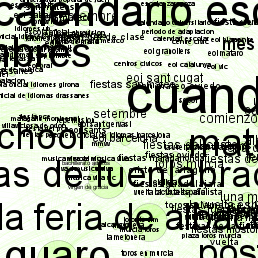
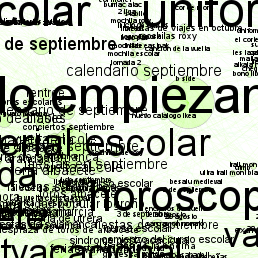
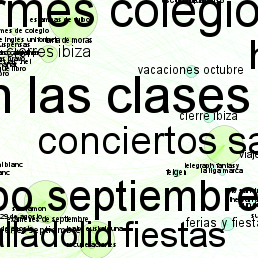
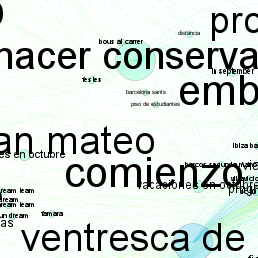
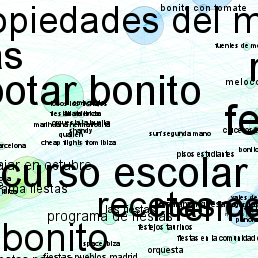
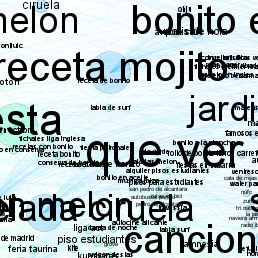
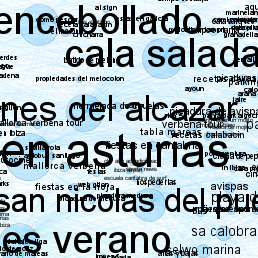
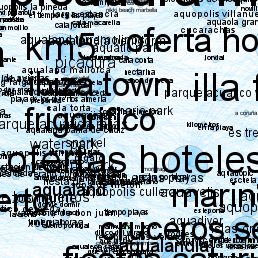
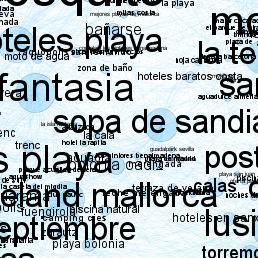
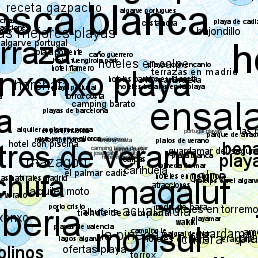
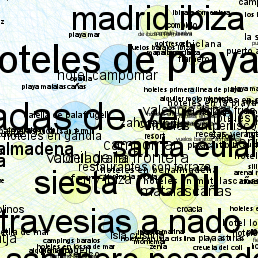
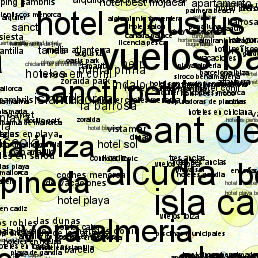
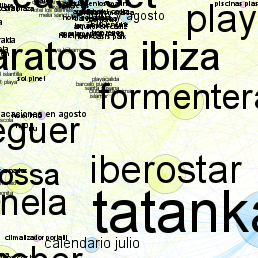
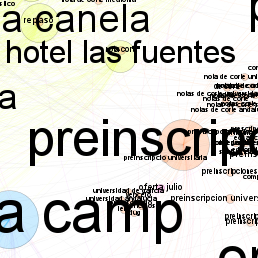
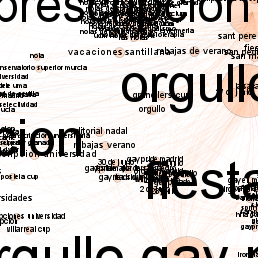
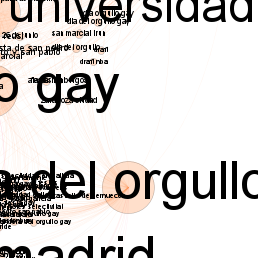














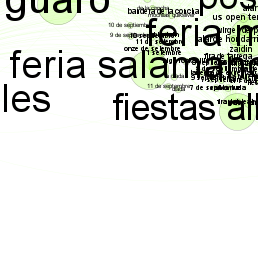
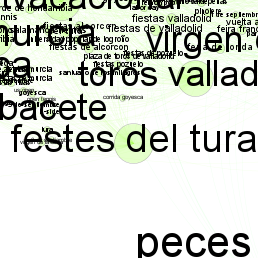
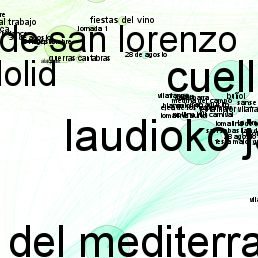
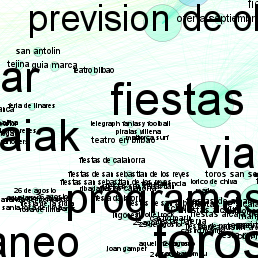
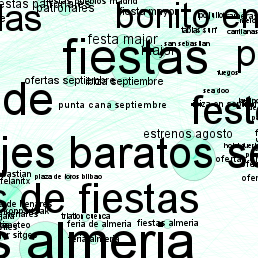
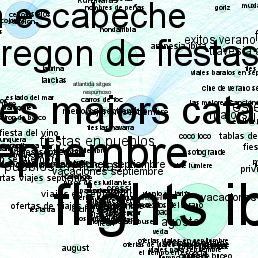
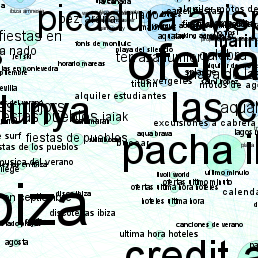
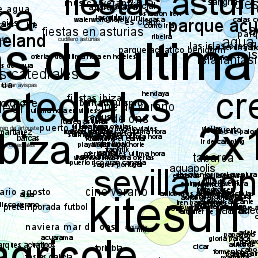
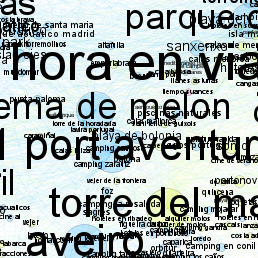
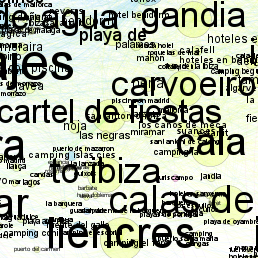
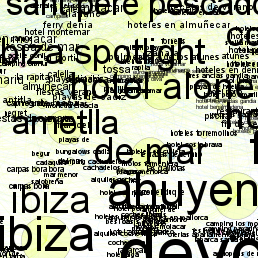
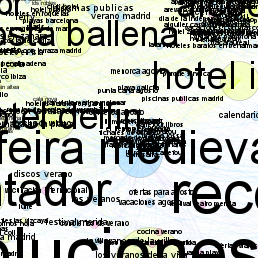
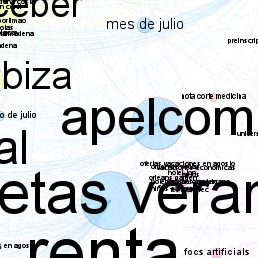
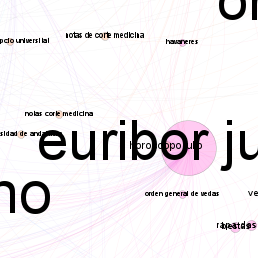
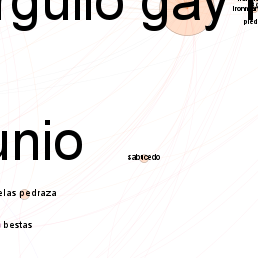

















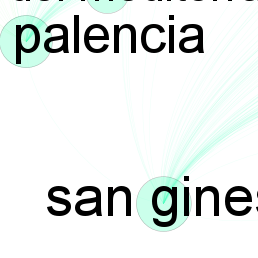
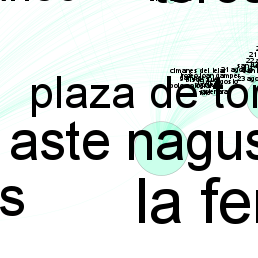
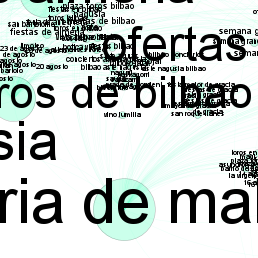
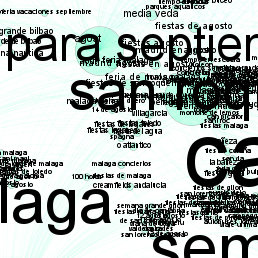
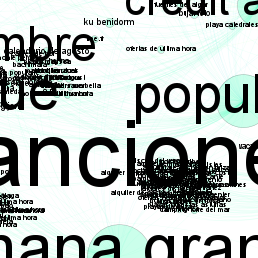
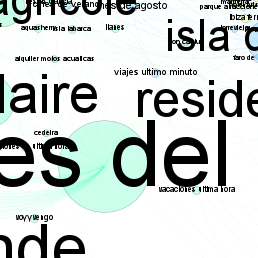
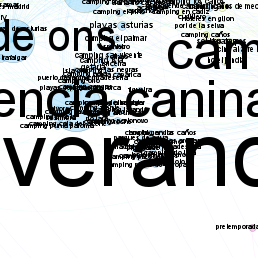
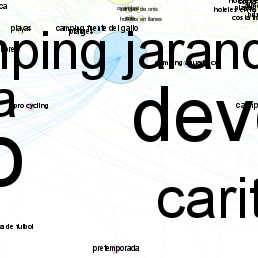
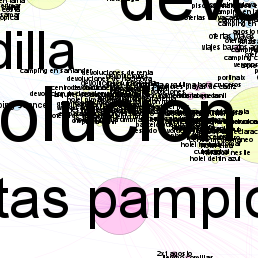
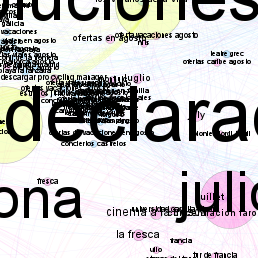
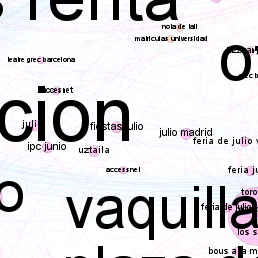
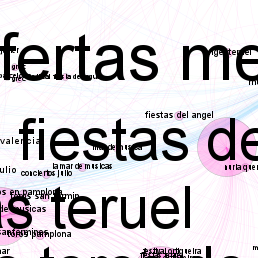
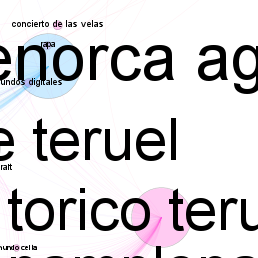

























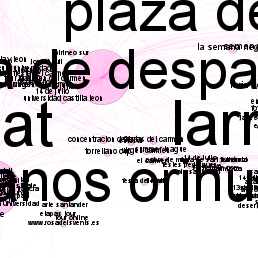
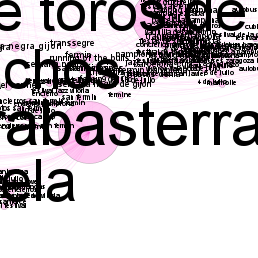
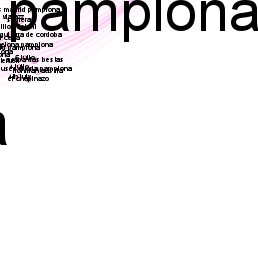


























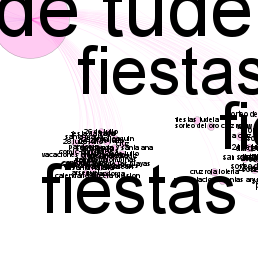
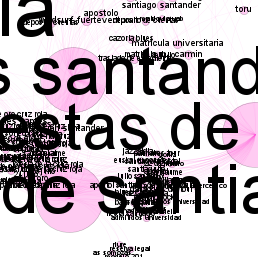










Neighbouring labels reflect the correlation-based analysis and graph layout; their proximity is not evidence of a causal relationship. The explanatory page survives, but the underlying time-series dataset and complete processing pipeline have not been recovered here. The image labels have not been transcribed into an accessible text dataset.
Read the original Spanish explanation and Seadragon configuration as plain text. The image tiles date from 19 April 2012; the final explanatory page was modified on 21 April. These are preserved file dates, not independently verified first-publication dates.
The restored display crops the one-pixel tile overlaps in CSS. It does not redraw, relabel or reinterpret the image. The original files remain preserved separately for provenance.